Operational Notes Methodology
The quick and dirty
As I’ve been getting back into operations over the past few months, I’ve been refining my operational note taking strategy. While there are great collaborative tools out there, like ASHIRT by the Yahoo! team, or more basic, git-’er-done tools like a Google sheet, I wanted something to stay more organized.
Enter Obsidian. I have long loved Obsidian and have predominantly used it for managing my own knowledgebase, using a setup very similar to the one discussed by the wonderful folks at TrustedSec.
You can see a demo of the process and get a tool to help expedite the set-up process for notes on my GitHub. For a more detailed explanation, keep on reading.
Obsidian strengths
Links
One of the key features of Obsidian that makes knowledge management easy is its linking functionality. Pop a [[]] around
the name of a file, and you’ve got yourself a new link to another document in your vault. That makes it trivial
to create pathways between different pieces of data without ending up with a monolithic document, which I believe
is essential when conducting a complex operation.
Plugins
Another great feature of Obsidian is its plugin-friendly design. While you can use many, the demo includes two: Admonition and DataView.
Admonition lets you create callout boxes around important information as shown above, because hey, the
Hugo template I’m using has a shortcode for that! Beyond callouts,
Obsidian lets you collapse Admonition blocks which I find very handy for keeping things clean when you have a lot
of screenshots. Simply put the ![imagename.png] references in an Admonition block with collapse: yes, and now
your 2-screen-lengths of images is 2 lines.
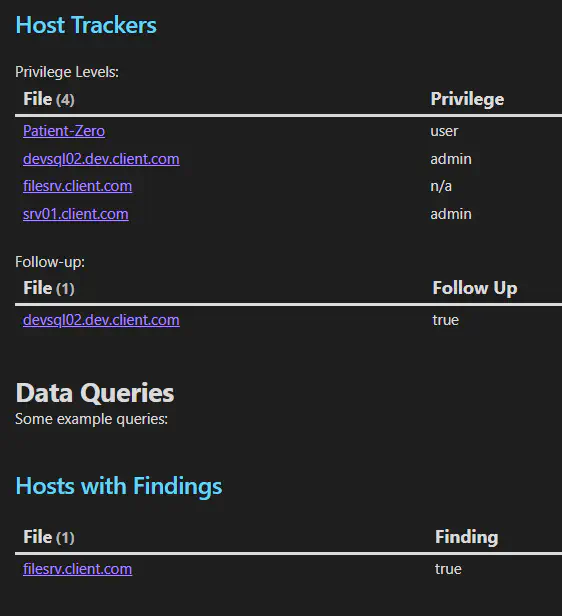
The other is DataView. DataView lets you query the frontmatter in your markdown files using a language similar to cypher. From this, you can create todo lists of hosts that you need to follow up on, find where you have admin privileges, list out the hosts that had findings for your report, or even query hosts for open SSH ports after doing an Nmap scan. This is the part that can become overkill, so pace yourself.
Canvas
The last major strength I’ll talk about is the Canvas feature. I hadn’t use this feature much in my knowledge base, relying more on links rather than mind maps, but for keeping track of an operation flow to write your report, it’s pretty killer.
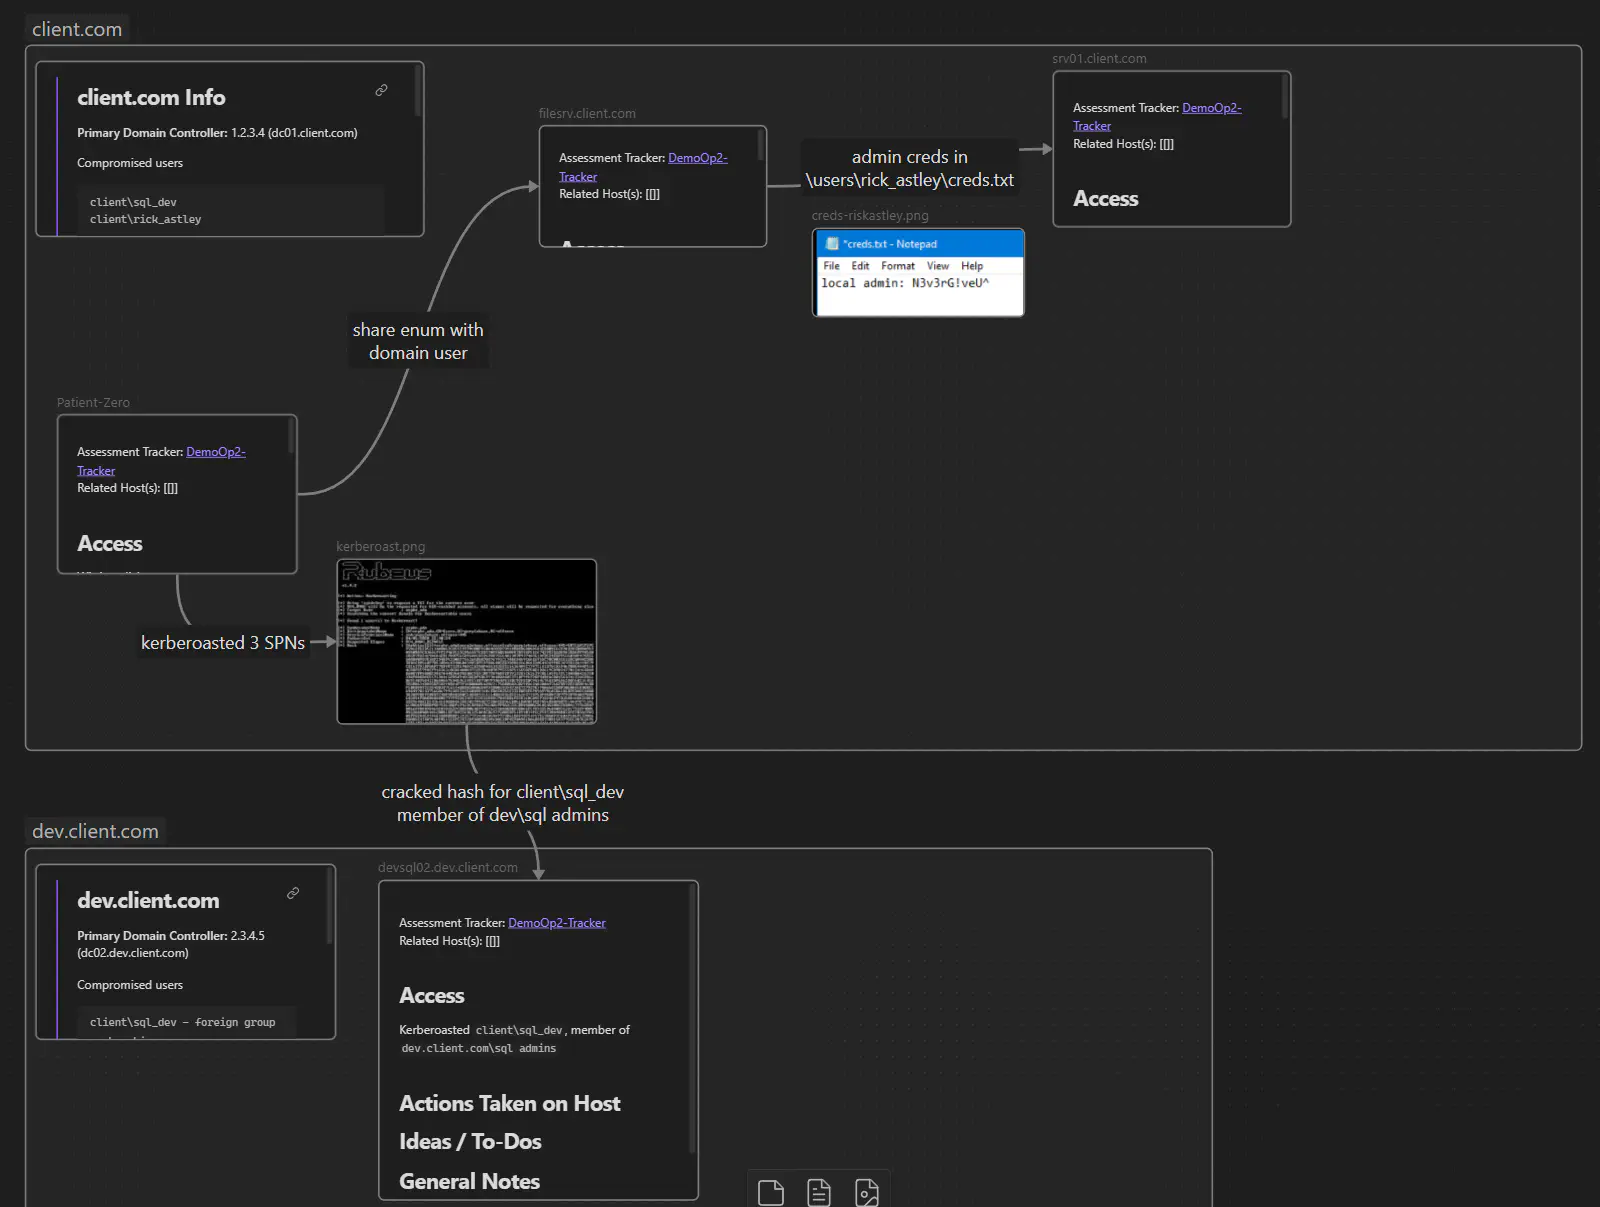
An example of Obsidian Canvas
Using the notes you’re already taking on different hosts or other activity, you can drag the markdown files or images into the canvas to create a flow and label the links between objects. Using Obsidian’s ability to directly embed content, including sub headings, and it can become a central view for your reporting or lateral-movement plotting.
The methodology
Structure
I settled on a file structure that looks like the below:
OpName/
|--Content/
|--Images/
|--OpName-Tracker
|--OpName-Finding
|--OpName-DomainInfo (Internal Layout)
|--OpName-Canvas (Internal Layout)
The central hub is the Tracker file. This one holds various helpful information about the operation, like client meeting notes or links to Jira, but it also
holds all of the DataView queries to get to other content. DataView can pull a list of files that link to the note it’s in with FROM [[]], so by linking
all of your other content notes to this tracker you can easily find what you’re looking for.
An example of Obsidian Canvas
The content folder will hold all of your host notes, file share enumeration, etc. because they can easily be found by linking back to the tracker note. Really just a way to keep things tidy. Same for the images folder.
The Finding note is one I played with for awhile. I initially kept findings in the host-note where it applied, but that resulted in more work down the line collecting
them all for the report. Instead, the Finding note in this setup holds all of your findings, collected under headings. Generally I’ll name the finding something
that indicates where it came from, e.g. # SQL Injection (app.client.com). Then, in the host note you can embed the finding details with ![[OpName-Finding#SQL Injection (app.client.com)]]
to still reference it as you’re working. But come reporting time, you can march down that single file.
Two additional files only apply to internal operations (versus external pentests): DomainInfo and Canvas. The canvas item is discussed above, and DomainInfo is really just a dumping ground for things I commonly need (“what’s the IP of that Domain Controller again so I can run this Impacket command…?”). Again using headings, you can embed that domain information into the canvas or other notes with ease.
Using it
If you’re a visual learner, check out the demo folder in the repository, which is a fully-loaded vault to showcase some of these features with dummy data.
The biggest key to utilizing this structure is to remember to link files back to the Tracker note as you create them. The folder structure in my repo includes some templates that you can insert into new files to keep things uniform if you set up a keyboard shortcut (or you could set up the Templater plugin - I can’t use that for reasons but TrustedSec’s setup linked above has a great starting point). From there, you do you, honestly. I prefer to keep everything - even general notes - in the Content folder for cleanliness. On internal exercises, I’ll create notes as I find things. For external exercises, I wrote a tool to parse a gnmap file and automatically create notes for all the alive hosts. In each case, I’ll generally jot down things I’ve tried or think I should try, paste in output or error messages, etc. This is highly individual, I tend to be a bit of a data hound.
Automating the process
I started doing this manually, just copying an empty folder and find-and-replacing my way through converting everything over. I finally decided to write a small tool to automate this setup and pushed it to my GitHub. The tool also includes a gnmap parser to automatically create hosts and add appropriate port/service frontmatter, should you choose.
The GitHub README has the usage info, so I’ll just add a few points here:
-
In terms of operational data, the parser only does gnmap files. This may change, but there’s also a point where recreating the wheel for something like BloodHound data is kinda silly. The parse function will also accept a host list (e.g., your scope) or a “map” file that ties a hostname to an IP. You can use the map in conjunction with a gnmap file to get better names on your notes.
-
Adding templates is (mostly) easy. Simply add a new .md file into the templates directory and the appropriate dict at the top of the Python file. HOWEVER: if you want to find-and-replace other text or parse different files, you’ll need to write your own functions for that. I didn’t write this as classes because I was just banging it out… maybe I’ll do that, but probably not.
-
Modifying templates is very easy. Just find the markdown file you want to change and change it. If you add frontmatter you want to track, make sure that gets added to your
.obsidian/types.jsonfile as well.
Wrap up
Note taking is very personal and I’m not 100% consistent in how I approach each op, this is merely a framework. I fully acknowledge this is a bit much for many people. But I had a few people express interest in ways to stay organized (or get organized) during operations, so I figured I’d share some ideas. Take the parts you like, delete others, add to them, modify them, do you.
Just remember why we do this: to provide solid data on where companies are vulnerable so they can get better. And that starts with ensuring accurate + clear information.